

The best place to know what’s happening in any Application server is logs.
Logging service:
In JBoss log4j is used for logging.
Logging is controlled from a central conf/jboss-log4j.xml file. This file defines a set of appenders specifying the log files, what categories of messages should go there, the message format and the level of filtering. By default, JBoss produces output to both the console and a log file (log/server.log).
There are 6 basic log levels used: TRACE, DEBUG, INFO, WARN, ERROR and FATAL. The logging threshold on the console is INFO, which means that you will see informational messages, warning messages and error messages on the console but not general debug and trace messages. If no logging level is set for the server.log file, it defaults to DEBUG.
If things are going wrong and there doesn’t seem to be any useful information in the console, always check the server.log file to see if there are any debug messages which might help you to track down the problem. However, be aware that just because the logging threshold allows debug messages to be displayed, that doesn't mean that all of JBoss will produce detailed debug information for the log file. You will also have to boost the logging limits set for individual categories. Take the following category for example.

This limits the level of logging to INFO for all JBoss classes, apart from those which have more specific overrides provided. By default the root logger in the jboss-log4j.xml is set to INFO. This effectively means that any TRACE or DEBUG logger from any logger categories will not be logged in any files or the console appender. This setting is controlled through the jboss.server.log.threshold property. By default this is INFO. If you were to change this to DEBUG, it would produce much more detailed logging output. In order to change this there are two options:
You can pass the -Djboss.server.log.threshold=DEBUG parameter while starting the server:

You can edit the $JBOSS_HOME/jboss-as-web/server/$PROFILE/conf/jboss-log4j.xml file directly in order to set this property:

**Note:
The $JBOSS_HOME/jboss-as-web/server/$PROFILE/conf/jboss-log4j.xml is scanned every 60 seconds (by default) to check for any changes. Changing this file does not require a server restart as the changes will be hot deployed within the next 60 seconds following the change.
As another example, let’s say you wanted to set the output from the container-managed persistence engine to DEBUG level and to redirect it to a separate file, cmp.log, in order to analyze the generated SQL commands. You would add the following code to the conf/jboss-log4j.xml file:

This creates a new file appender and specifies that it should be used by the logger (or category) for the package org.jboss.ejb.plugins.cmp.
The file appender is set up to produce a new log file every day rather than producing a new one every time you restart the server or writing to a single file indefinitely. The current log file is cmp.log. Older files have the date they were written added to their filenames. Please note that the log directory also contains HTTP request logs which are produced by the web container.
By default the server.log appender is configured to retain log messages between server restarts. This is controlled by the Append property on the FILE appender which corresponds to the server.log file. By default this property is set to true; if you want the server.log contents to be wiped out on server restarts
then you can edit the $JBOSS_HOME/jboss-as-web/server/$PROFILE/conf/jboss-log4j.xml file to set this property value to false. For example:

Thread Dump:
A Java thread dump is a way of finding out what every thread in the JVM is doing at a particular point in time. This is especially useful if your server sometimes seems to hang when running under load, as an analysis of the dump will show where the threads are stuck.
How to take a thread dump?
**The thread dump should be taken when the server is running.
There are many ways to take Thread dump. I will explain 3 simple ways to take thread dump in windows operating system.
First method:
To take the thread dump you should know the Process ID (PID).
Open the command prompt and type the following command
Step1:
jps -lm

The jps command shows the currently running java processes.

1252 is the process ID of instance all
3344 is the process ID for instance Instance1
This is how you get to know the process ID
Step2:
Now type the following command
jstack -l PID > dump.html

The thread dump will be stored in your current working directory with file name dump.html.
Second method:
Using twiddle:
Navigate to the following location using command prompt.
JBoss_Home\bin
Type the following command
twiddle -s localhost:1199 -u admin -p admin invoke “jboss.system:type=ServerInfo” listThreadDump> FileName.html

Where port is the service binding port which you can find in the jboss-service.xml or in sample-bindings.xml

Third method:
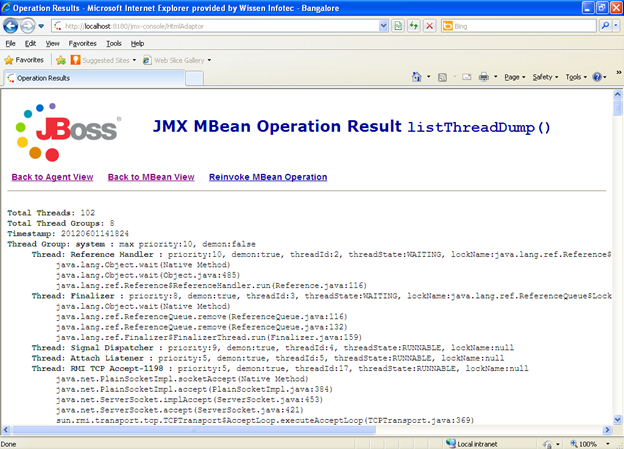
Through JMX Console
Open JMX Console
Type jboss.system and click ApplyFilter

Click on type=ServerInfo


Now search for java.lang.String listThreadDump() method and click on invoke

0 comments:
Post a Comment