

The best place to know what’s happening in any Application server is logs.
Logs:
DAS (Domain Administration Server)
domain-dir/logs/server.log
Each Server Instance
instance-dir/logs/server.log
The full path would be GlassFish_Home/glassfish/nodes/Node-Name/ instance-dir/logs/server.log
Cluster Instance
instance-dir/logs/cluster.log
Log Format:
Oracle GlassFish Server log records follow a uniform format:
[#|yyyy-mm-ddThh:mm:ss.SSS-Z|Log Level|ProductName-Version|LoggerName|Key Value Pairs|Message|#]
Logs:
- Server log files, which capture information about the operation of a server instance running in the domain. Each instance, managed server instance (that is, each cluster member), and the domain administration server (DAS) has an individual server log file.
- Cluster log files, which capture information about the operation of a cluster instance, if one or more are configured in the domain. Each managed server instance that is a member of a cluster has a cluster log file in addition to a server log file. However, the contents of the cluster log file may differ from one instance to another depending on factors such as how instances are apportioned in the cluster, applications running on them, how load balancing is configured, and failover state.
DAS (Domain Administration Server)
domain-dir/logs/server.log
Each Server Instance
instance-dir/logs/server.log
The full path would be GlassFish_Home/glassfish/nodes/Node-Name/ instance-dir/logs/server.log
Cluster Instance
instance-dir/logs/cluster.log
Log Format:
Oracle GlassFish Server log records follow a uniform format:
[#|yyyy-mm-ddThh:mm:ss.SSS-Z|Log Level|ProductName-Version|LoggerName|Key Value Pairs|Message|#]
- [# and #] mark the beginning and end of the record.
- The vertical bar (|) separates the fields of the record.
- yyyy-mm-ddThh:mm:ss.SSSS-Z represents the date and time that the record was created. For example: 2006-10-21T13:25:53.852-0400
- Log Level represents the log level. You can set any of the following values: SEVERE, WARNING, INFO, CONFIG, FINE, FINER, and FINEST. The default is INFO.
- ProductName-Version represents the current version of the Oracle GlassFish Server. For example: glassfish
- LoggerName represents a hierarchical logger namespace that identifies the source of the log module. For example: javax.enterprise.system.core
- Key Value Pairs represents pairs of key names and values, typically a thread ID. For example: _ThreadID=14;
- Message represents the text of the log message. For all Oracle GlassFish Server SEVERE and WARNING messages and for many INFO messages, the message begins with a message ID that consists of a module code and a numerical value. For example: CORE5004
The following is an example of a log record:
[#|2006-10-21T13:25:53.852-0400|INFO|GlassFish10.0|javax.enterprise.system.core|_ThreadID=13;|CORE5004: Resource Deployed: [cr:jms/DurableConnectionFactory].|#]
Thread Dumps:
A Java thread dump is a way of finding out what every thread in the JVM is doing at a particular point in time. This is especially useful if your server sometimes seems to hang when running under load, as an analysis of the dump will show where the threads are stuck.
How to take a thread dump?
**The thread dump should be taken when the server is running.
There are many ways to take Thread dump. I will explain 3 simple ways to take thread dump in windows operating system.
To take the thread dump you should know the Process ID (PID).
Navigate to the server’s config folder.

In the config folder the PID of the server is stored in the pid file.
Type the following command:
C:\glassfish3\glassfish\bin> jstack –l PID > FileName.html

The thread dump will be stored in your current working directory with file name FileName.html.
asadmin> generate-jvm-report --type=thread --target=ServerName --port 4848
The above command generates the thread dump for Admin Server (server).
Through Admin Console:
Click on the server and click on the JVM Report.
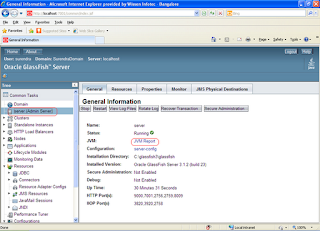
Select Thread Dump as view.

Similarly you can take thread dump for any server instance.
[#|2006-10-21T13:25:53.852-0400|INFO|GlassFish10.0|javax.enterprise.system.core|_ThreadID=13;|CORE5004: Resource Deployed: [cr:jms/DurableConnectionFactory].|#]
Thread Dumps:
A Java thread dump is a way of finding out what every thread in the JVM is doing at a particular point in time. This is especially useful if your server sometimes seems to hang when running under load, as an analysis of the dump will show where the threads are stuck.
How to take a thread dump?
**The thread dump should be taken when the server is running.
There are many ways to take Thread dump. I will explain 3 simple ways to take thread dump in windows operating system.
First method:
Open command prompt, you can do this by typing cmd in runTo take the thread dump you should know the Process ID (PID).
Navigate to the server’s config folder.
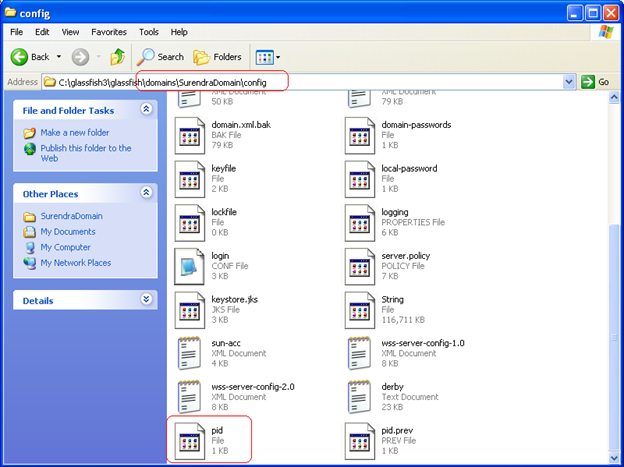
In the config folder the PID of the server is stored in the pid file.
Type the following command:
C:\glassfish3\glassfish\bin> jstack –l PID > FileName.html
The thread dump will be stored in your current working directory with file name FileName.html.
Second method:
Open the asadmin utility and type the following commandasadmin> generate-jvm-report --type=thread --target=ServerName --port 4848
The above command generates the thread dump for Admin Server (server).
Third method:
Through Admin Console:
Click on the server and click on the JVM Report.

Select Thread Dump as view.

Similarly you can take thread dump for any server instance.
0 comments:
Post a Comment